- The Bollinger band squeeze happens when price movements contract to a narrow range.
- This causes the Bollinger bands to move inwards towards each other.
- It is almost like a pressure is building within the market and it will lead to a sharp movement in prices sooner rather than later.
- In the example, a squeeze always occurred before any significant move in prices.
- It is a valuable indication of the possibility of volatility ahead.
So a trader will always be aware of the position and trend in the Bollinger bands. And if you notice the Bollinger bands ‘squeeze’ together, you can start to position yourself because a significant price movement is straight ahead.
How does it work ?
The Bollinger Bands Squeeze Strategy uses 4 components which are Bollinger Bands, Bollinger Band Width, Bollinger Band %B and Volume.
Bollinger Bands and Bollinger Band Width is used to determine a period of very low volatility. This is because very often after a period of low volatility price will break out with a force that gives the trader an opportunity to profit from the move. Bollinger band should be contracted. Band Width should be a low value (below 0.1000) to confirm squeeze.
The Bollinger Band %B is used for extra evidence that the breakout will not be a fake one. It is used in a way that if %B is above the midpoint (value of 0.50) indicating that price is closer to the upper band than lower band then it supports a breakout to the upside and if %B is below the midpoint (value of 0.50) indicating that price is closer to the lower band than upper band then it supports a breakdown to the downside.
If a breakout happens to the upside but %B has been below midpoint the majority of the time than the odds favours that it might be a fake breakout. This is because prior to the breakout the sellers were in control instead of the buyers.
The last component used in this day trading strategy is volume. This is a very important component as volume alone can save you from a lot of fake breakouts. If there is not a significant increase in volume on the break of resistance/support than the chances are that the move is not strong enough to continue in your direction.
The setup explained in very simple terms would be look for contracted Bollinger Bands with a low reading of Bollinger Band Width. When looking for long make sure the %B has been above the midpoint prior to the break of the resistance. Final thing is the volume increase. The trigger is fired when resistance is taken out.
When looking for short then %B needs to have been below %B and price should break support. Volume is also important when going short.
Entry for Long
- Bollinger Band contracted
- Band Width showing squeeze (below the 0.1000)
- %B > 0.50 before breakout
- Volume increase
- Breaking Resistance
Exit for Long
- TGT: Pulling away from upper band
- SL: Initial SL below the base
- Trailing SL: Trailing SL should be 20 MA
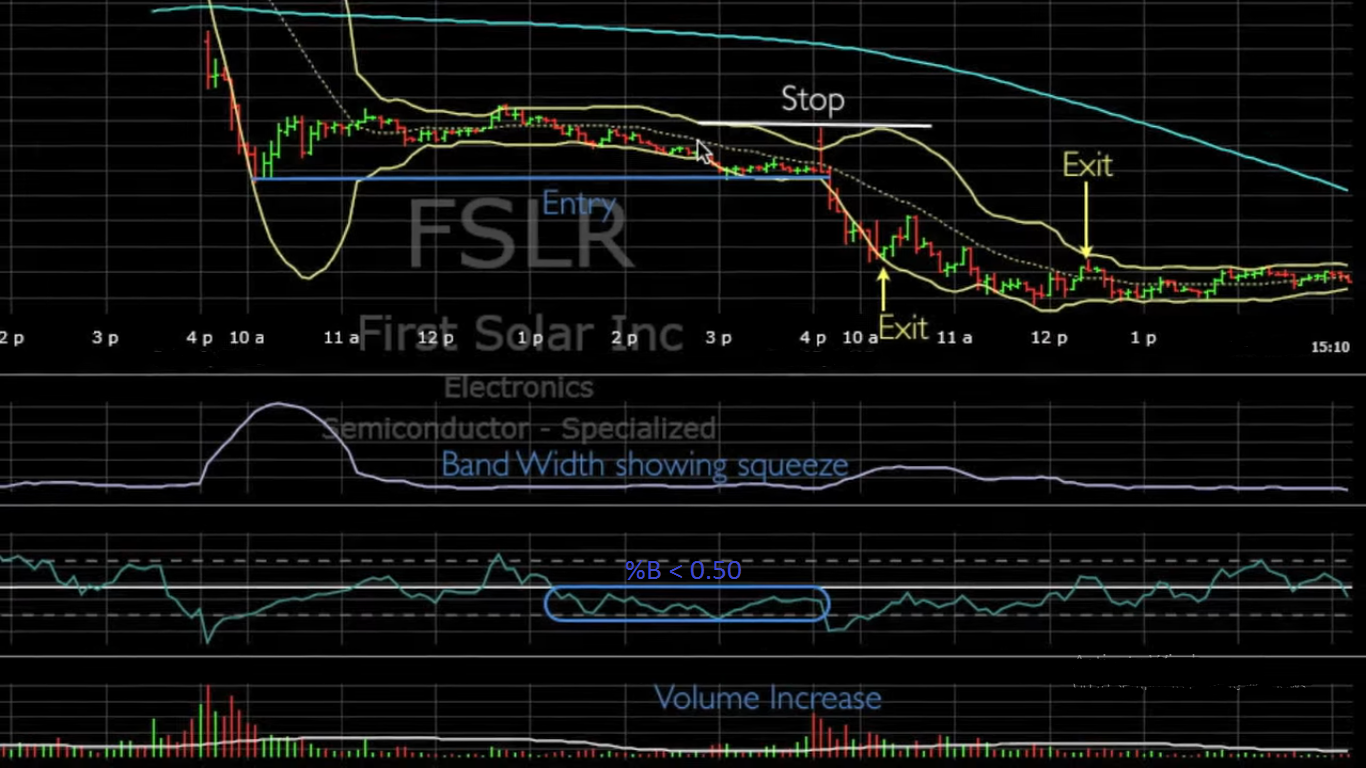
Entry for Short
- Bollinger Band contracted
- Band Width showing squeeze (below the 0.1000)
- %B < 0.50 before breakdown
- Volume increase
- Breaking Support
Exit for Short
- TGT: Pulling away from lower band
- SL: Initial SL above the base
- Trailing SL: Trailing SL should be 20 MA